Why is my PageSpeed score low when my site loads fast?
·13 min read·Ezra Seal
core web vitals · largest contentful paint · next.js · performance
Key takeaways
- If your Largest Contentful Paint is bad but your Total Blocking Time is near zero and your layout shift is zero, the page is not slow. Something is rendering it invisible.
- The most common cause on a modern React site: a scroll-reveal animation whose hidden state gets server-rendered, so the hero ships to the browser at
opacity: 0and cannot appear until JavaScript has downloaded and hydrated. - Chrome ignores any element with
opacity: 0as a Largest Contentful Paint candidate. A fade-in from zero does not register when the fade starts — it registers on some later, unrelated repaint, or not at all. - Cookie and consent banners are a frequent second offender. On a phone they are nearly full-width, so a banner that fades in three seconds after load can become the element Google times your page by.
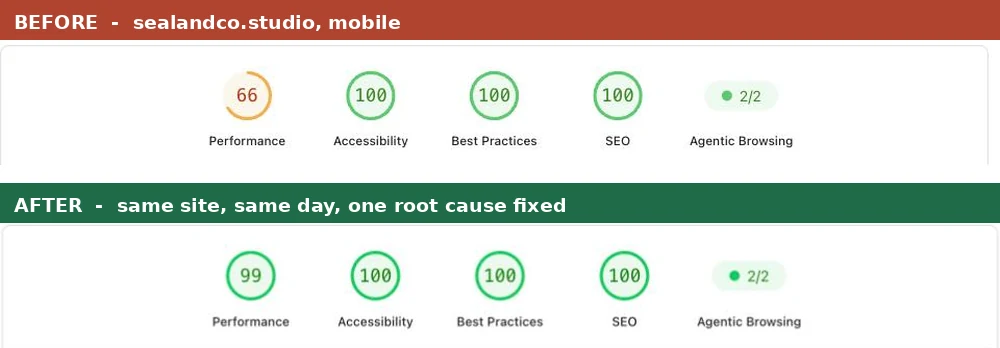
- Our own homepage went from 66 to 99 on mobile in one pass. We changed no images, removed no features, and the hero animation looks identical. Largest Contentful Paint went from 6.5s to 1.5s.
Why is my PageSpeed score low when my site loads fast?
Because PageSpeed does not measure when your page finishes loading. It measures when a human can see it. Those are different numbers, and a page can win the first and lose the second badly — most often because something on the page is deliberately invisible until JavaScript says otherwise.
Some scale before the confession, because it matters for how you read the number. The median mobile performance score across roughly 6.8 million sites is 31. The 90th percentile is 80. Only about one site in ten clears 80 at all. In field data, 48% of mobile sites pass Core Web Vitals.
So this is not a post about a badly built website. It is a post about a number that was measuring the wrong thing.
Days after launching, our own studio homepage scored 66 on mobile — while the server was delivering the HTML in 210 milliseconds from a warm cache, the main thread sat idle, and nothing on the page shifted by a pixel. Nothing about it was slow. It was hidden.
What does a high LCP with a near-zero Total Blocking Time mean?
It means your problem is rendering, not work. This specific combination is the most useful diagnostic signal in the whole report, and almost nobody reads it.
Here is what our report said before we touched anything:
| Metric | Value | What it tells you | |---|---|---| | Largest Contentful Paint | 6.5 s | Something big took 6.5s to appear | | Total Blocking Time | 40 ms | The main thread was almost never busy | | Cumulative Layout Shift | 0 | Nothing jumped around | | Time to First Byte | 210 ms | The server was fast |
Read those together. If the CPU was idle (40ms of blocking) and the server was fast (210ms) and nothing shifted (0), then what exactly took six and a half seconds? Not downloading. Not executing. Not reflowing.
The answer is that the content existed in the HTML the whole time and was simply not visible. Lighthouse said as much, if you expand the right panel: Time to First Byte 0 ms, element render delay 3,110 ms. It had the content. It was waiting to be allowed to show it.
How to read this in 10 seconds
High LCP + high TBT means you have too much JavaScript. That is the common case and there is a mountain of advice for it.
High LCP + low TBT means something is hiding your content. It is a completely different problem, it has nothing to do with bundle size, and shaving kilobytes will not move it an inch. We spent the first part of this diagnosis measuring bundles that turned out to be irrelevant.
Why does Framer Motion hurt Largest Contentful Paint in Next.js?
Because the state Framer Motion server-renders is the hidden one. In the Next.js App Router, a client component still renders on the server for the initial HTML — and for a motion element with initial="hidden", the hidden variant is what gets written into that HTML as an inline style.
This is what our hero actually looked like in the response body, before any JavaScript ran:
<div style="opacity:0">
<p class="type-eyebrow">Seal & Co. · Vancouver, Washington</p>
</div>
<div class="overflow-hidden">
<div style="transform:translateY(108%)">
<h1>The messy online side of your business…</h1>
</div>
</div>
<div style="opacity:0;transform:translateY(28px)">
<p>Seal & Co. is a lean, design-led studio…</p>
</div>
Every word of the headline is right there in the HTML. All of it is unreadable. The eyebrow is transparent, the <h1> is translated 108% down inside a clipping mask, the paragraph is transparent and offset.
The trigger made it worse. The component used the standard scroll-reveal pattern:
<motion.div
  initial="hidden"
  whileInView="visible"
  viewport={{ once: true, amount: 0.2 }}
  variants={{ hidden: { opacity: 0, y: 28 }, visible: { opacity: 1, y: 0 } }}
>
whileInView needs an IntersectionObserver. An IntersectionObserver needs hydration. So the sequence for a first-time mobile visitor was: download the HTML (fast), download the JavaScript, parse it, hydrate React, construct the observer, fire the callback, then start a 0.7-second animation with a 0.15-second delay.
Below the fold, none of that matters — nobody has scrolled there yet, so hydration is free. Above the fold it is the entire experience. The same component that is correct in one place is the whole problem in the other. That distinction is the fix, and it is a design decision, not a performance one.
Here is what a visitor on a normal desktop connection actually saw four seconds in. This is not a throttled test:

Does a fade-in animation delay Largest Contentful Paint?
Yes, and in a way that is stranger than most people expect. Chrome does not count an element with opacity: 0 as a Largest Contentful Paint candidate at all — a rule it has applied since August 2020.
The surprising part is what happens next. An element fading in from zero does not get its LCP recorded when the fade begins. As DebugBear documents it, the element only becomes a candidate when it is repainted for some other reason — a web font finishing, a resize, an unrelated DOM change. So your measured LCP can land far away from the moment a human could actually read the text, and the W3C spec group has an open issue acknowledging that the impact of animations on LCP is unspecified.
There is a known trick here: start the fade at opacity: 0.1 instead of 0 so the first paint counts. Be careful with it. It improves the number without moving the moment your visitor can read anything, and if that is all you do, you have optimised the dashboard rather than the site.
What we're not going to pretend
Our fix moved the hero out of the LCP calculation as a side effect, because the CSS entrance still starts from opacity: 0. If we had stopped there, we would have bought a score.
The reason we think the fix is real is separate from the score: we recorded the hero's entrance frame by frame on a throttled phone, before and after. The pixels genuinely arrive about 0.9 seconds after first paint now, instead of after a full hydration cycle. The number moved because the experience moved. If you cannot demonstrate that second part with a filmstrip, you have not fixed anything — you have moved a metric.
Why is my cookie banner the Largest Contentful Paint element?
Because on a phone it is close to full-width, and Largest Contentful Paint means largest, not most important. A consent panel that slides up a few seconds after load can easily be the biggest thing that has painted, at which point Google times your entire page by your cookie notice.
Ours did exactly this, and we only found it after fixing the hero — the second bug had been hiding behind the first. Our notice waited 2.5 seconds before appearing, for a good reason written in the code comments: landing on a page and having a panel cover the headline before you have read a word is the thing everyone hates about these. But a near-full-width panel fading in at 2.5s became the LCP element, worth roughly 17 PageSpeed points on its own.
It was also, we noticed in the before-and-after screenshots, sitting directly on top of the hero's primary call to action.
We kept the intent and changed the signal: the notice now waits for the visitor's first scroll, with a long dwell-time fallback for someone who lands and never scrolls. A scroll is better evidence of "they have read a bit" than a stopwatch ever was. It also sidesteps the measurement problem honestly, because Chrome stops recording LCP at the first scroll, tap or keypress — by the time the notice arrives, the page has already been measured on its own content, which is what LCP is supposed to be measuring.
How do I fix this without losing the animation?
Move the above-the-fold entrance into CSS, and leave everything below the fold alone. CSS animations start at first paint and need nothing from the main thread, so the entrance plays at the same speed on a £90 Android as on your laptop.
The important detail is that this is a copy, not a redesign. Mirror the existing variants exactly — same distances, same durations, same easing curves:
@keyframes sc-rise {
  from { opacity: 0; transform: translateY(28px); }
  to   { opacity: 1; transform: none; }
}

.sc-reveal-rise {
  animation: sc-rise 0.7s cubic-bezier(0.22, 1, 0.36, 1) both;
}
Three things worth knowing:
animation-fill-mode: bothis not optional. Without it, an element with a delay paints in its final position, blinks out when the delay starts, then animates in.- The bezier is a direct translation. Framer Motion's
ease: [0.22, 1, 0.36, 1]iscubic-bezier(0.22, 1, 0.36, 1). If you do not specify an ease, Framer Motion's tween default iseaseOut, which iscubic-bezier(0, 0, 0.58, 1). - Reduced motion comes free if you already collapse animation durations in a
prefers-reduced-motionblock — and it now resolves without waiting for hydration, which is a small accessibility win on top.
We verified the result was visually identical rather than assuming it: same browser, same viewport, screenshots of the settled hero before and after, diffed pixel by pixel. The hero text region came back identical. The only differing pixels on the entire page were an ambient drift animation caught at a different point in its loop.

On mobile, this was the first time the animation had ever really been visible. Before, it fired so late that it did not read as an entrance at all — it read as a slow website.
How do I check whether this is my problem?
Four steps, about five minutes, no tools beyond your browser.
If you don't have a report yet, run our free Speed Check. It calls Google's own PageSpeed API and gives you the same Lighthouse numbers this article is about, on both mobile and desktop, with a link to verify the run against Google directly.
- Look at Total Blocking Time next to Largest Contentful Paint in your PageSpeed report. If LCP is bad and TBT is under ~200ms, keep going. If TBT is also bad, you have an ordinary JavaScript problem and this is not your article.
- View source on your own homepage — actual View Source, not DevTools' Elements panel, which shows you the page after JavaScript has run. Search the HTML for
opacity:0. If your headline is wrapped in one, you have found it. - Expand "LCP breakdown" in the PageSpeed report. A large element render delay with a near-zero time to first byte is the signature. Ours read 3,110ms of render delay against 0ms of TTFB.
- Hard-reload with a throttled connection in DevTools and watch the first two seconds. If the page is blank and then everything appears at once, that is hydration, not bandwidth.
What this cost, and what it moved
One pass. No images changed, no features removed, no dependencies added, no content rewritten.
| | Before | After | |---|---|---| | Mobile performance | 66 | 99 | | Desktop performance | — | 100 | | First Contentful Paint | 3.38 s | 0.97 s | | Largest Contentful Paint | 6.52 s | 1.50 s | | Total Blocking Time | 40 ms | 109 ms | | Cumulative Layout Shift | 0 | 0 |
Blocking time went up, not down. Moving the analytics loader and deferring the scroll library shifted some work later into the load rather than removing it. 109ms is still comfortably inside "good," so we left it, but it would be dishonest to print a table where every row improved.
What a 99 does and does not prove
This is a lab score. Our own report still says "No Data" for what real users experience, because a site launched this month does not have enough traffic for Chrome's field data yet — and field data is the part Google actually uses.
So the honest claim is not "our site is in the top one percent." It is "our lab number is 99, and we will find out what the real one is when the traffic arrives." Anyone quoting a Lighthouse score at you as proof of real-world speed, us included, is quoting a simulation.
The other half of the honesty: this site was already built to score well before we touched it. Almost no third-party JavaScript, static prerendering, next/image on essentially everything, next/font with metric-matched fallbacks — which is why layout shift was zero without anyone working at it. Across the web, 76% of mobile pages have an image as their LCP element and 17% lazy-load the very image that is their LCP. We had none of those problems, which is precisely why there was a single root cause to find instead of forty small ones. A site carrying twelve plugins and three tag managers does not make this jump in an afternoon.
The reason this is worth writing down is not the score. It is that for months the honest read of that report was "our site is slow, we should strip things out" — and that read was wrong. The site was fast the whole time. It was hiding.
If a report is telling you to remove the parts of your site you like most, get a second opinion on what it is actually measuring before you start deleting. That is most of what we do: tell you where the real problem is, which is frequently not where the number is pointing.
Everything above was measured on sealandco.studio between 4:48 PM and 7:26 PM on 25 July 2026. The before and after reports are public in PageSpeed Insights, and the fix is two commits in our repo.